Investor Analytics Chartbook Overview
The Investor Analytics chartbook allows investors to download an Excel file containing standardized financial statements and auto-populated charts, allowing investors to quickly access and manipulate accurate, current financial data from companies.
Investment analysis requires accurate, current financial data and Hum understands the importance of getting this data into the hands of investors quickly, easily, and in the right format. Hum Capital enables investors to download an Excel file containing standardized, current company-financial data and analytics for investment opportunities presented by Hum.
The Excel file comes directly from company data systems and presents monthly, quarterly and annual Income Statements and Balance Sheets. The financial summaries are in a standardized format for reviewing or easy incorporation into your own screening, analysis, and internal presentation processes. This is in addition to reviewing the presentations and documents that companies have uploaded into the data room portion of the Hum Capital ICM.
Often the data provided to Hum is connected directly to the company’s accounting system. When this occurs, the data within the Excel file will refresh weekly.
What is included in the Excel file
We have made the following available on a monthly, quarterly, and annual basis in a standardized Excel file:
- Income Statement Summary
- Balance Sheet Summary
Below is an example of the Investor Analytics Excel file chartbook.

Another powerful tool this feature includes are dynamic charts which are auto-created and auto-populated for each company on our platform. You can use these charts to quickly and visually evaluate companies’ performance. You can even incorporate them in your one-sheets, Investment Committee memos, and presentation decks. Some of these charts include:
- Quarterly Revenue
- Quarterly EBITDA
- Monthly Revenue with associated margin
- Working capital
Below is an example:

How to access Investor Analytics chartbook
To access this feature, you first access a deal you have matched with in your Hum account.
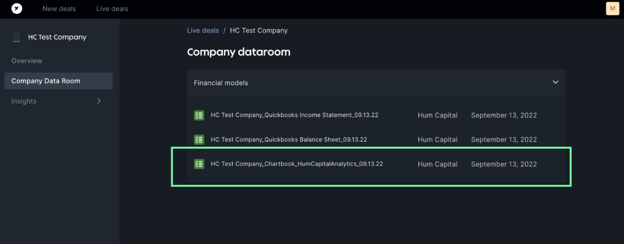
You then select a company where you will be taken to the company’s Data Room. As you scroll down this page you will see a file including the name “Chartbook” that was created by Hum Capital.
From there, you will have downloaded the Investor Analytics Excel chartbook. There is currently no limit on the amount of data that you can download.
Investor Analytics data source
The raw data Hum uses to create its financial summaries comes from data connectors which directly pull from a company’s financial systems of record such as Quickbooks and Xero. The Hum’s ICM puts this data in a standardized format and refreshes it automatically to provide you with a current, accurate financial summary.
In some cases the data is uploaded manually by the company. The financial summary will indicate the source for a given company.
Quickbooks Income Statement, Balance Sheet
Investors are able to see Income Statements and Balance Sheets created with data pulled directly from companies’ Quickbooks accounting connectors, allowing granular source-of-truth data to evaluate potential investments.
Investment analysis requires accurate, current financial data and Hum understands the importance of getting this data into the hands of investors quickly, easily, and in the right format. Hum Capital now enables investors to download an Income Statement and Balance Sheet pulled directly from companies’ Quickbooks accounting software. This means that the line items on the Income Statement and Balance Sheet will be the originals that a company used within their accounting. This will provide additional detail and granularity for analyses, while the Investor Analytics chartbook will aid by presenting connector file information in a standardized format.
What Is Included:
The Income Statement and Balance Sheet will pull original line items from companies’ Quickbooks connectors. They will surface monthly financials for the past 3 years. Below is a screenshot of a sample:

For any additional questions, please contact support@humcapital.com.